Analyze Text Events
Prerequisites
This guide assumes that you've uploaded some data, created your first attribute, and refined the categories to finalize the attribute.
Analyzing Text Events in Tidepool
Charting is only available for finalized attributes.
If you don't see all of your attributes as options on the Analyze page, swap to the Discover page and confirm the correct attributes are listed as finalized in the sidebar.
Charting Sessions or Events by Category
Tidepool allows you to chart events and sessions over time or aggregated over some date, segmented by your derived attributes and categories.
- Navigate to the Analyze page from the top menu bar.
- Apply any searches, filters, pivots, normalizations, or "Color By" selections.
- See how your events/sessions correlate with any related metadata you've uploaded, such as whether the user gave the interaction a thumbs up or a thumbs down.
Overview View
Overview View is the default view, as it provides the most control over how you want to analyze the relationship between your events' categories and other metadata.
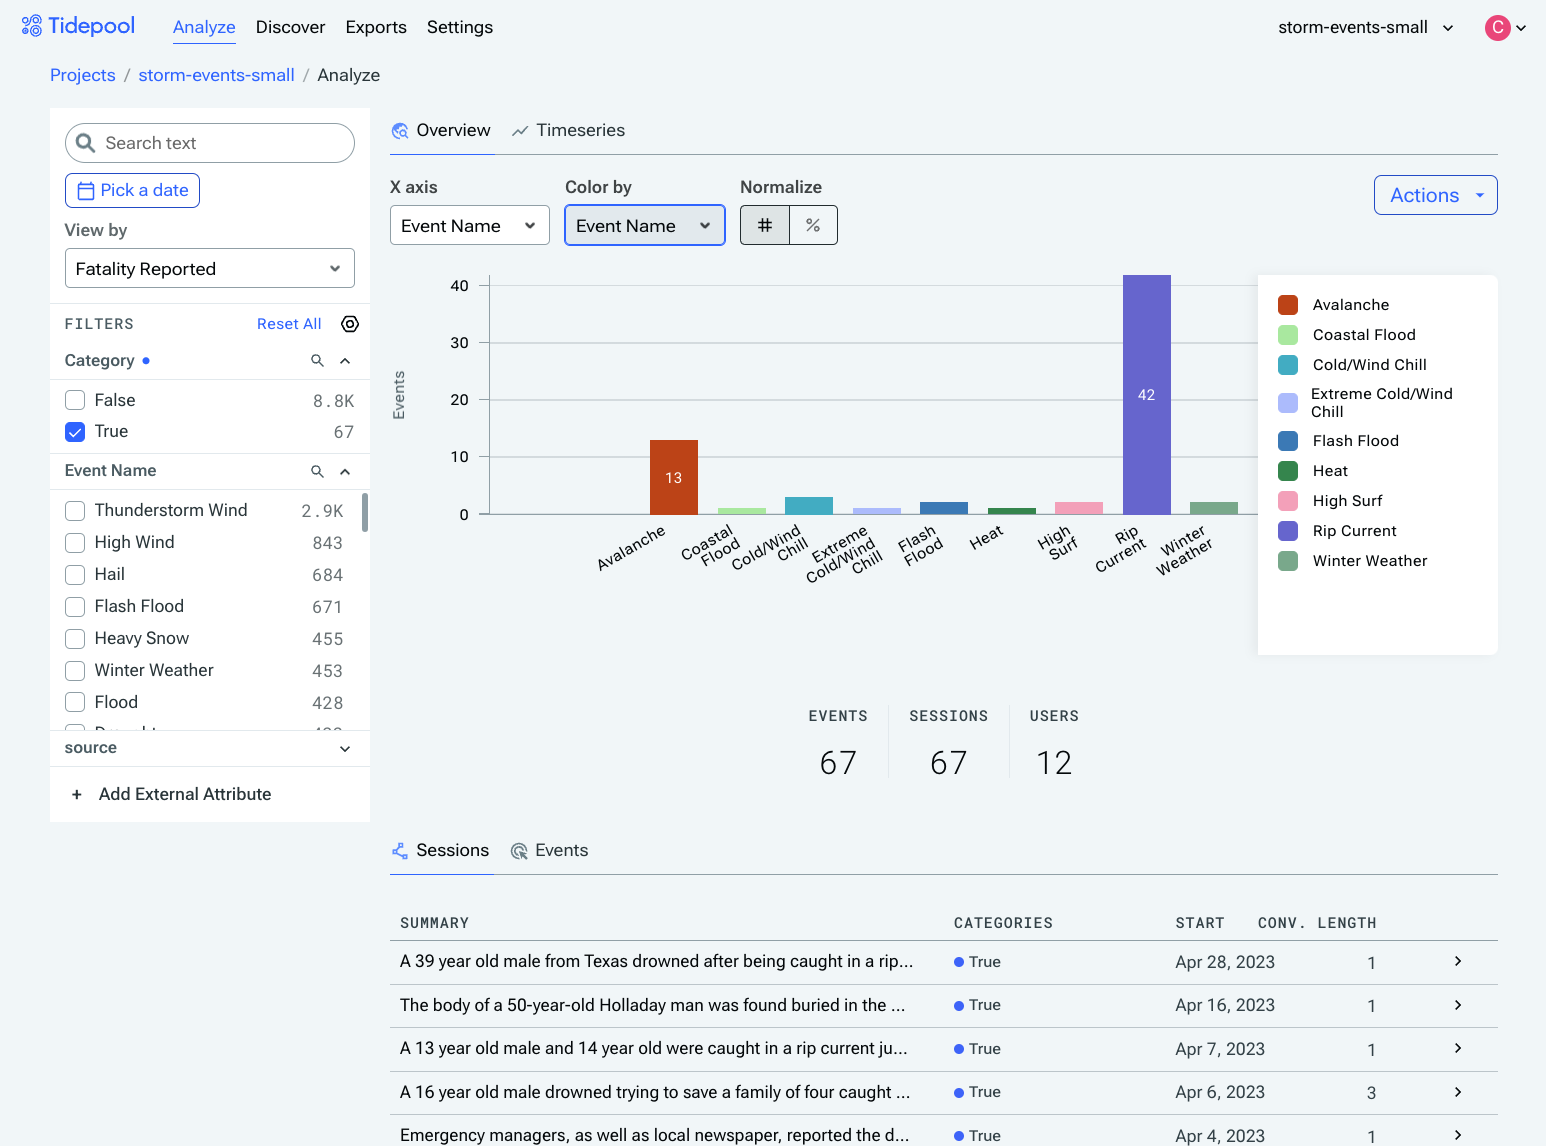
Overview View
Timeseries View
You can also view events/sessions over time, as a time series. Move your cursor over the graph to see how many events/sessions occurred on that date.
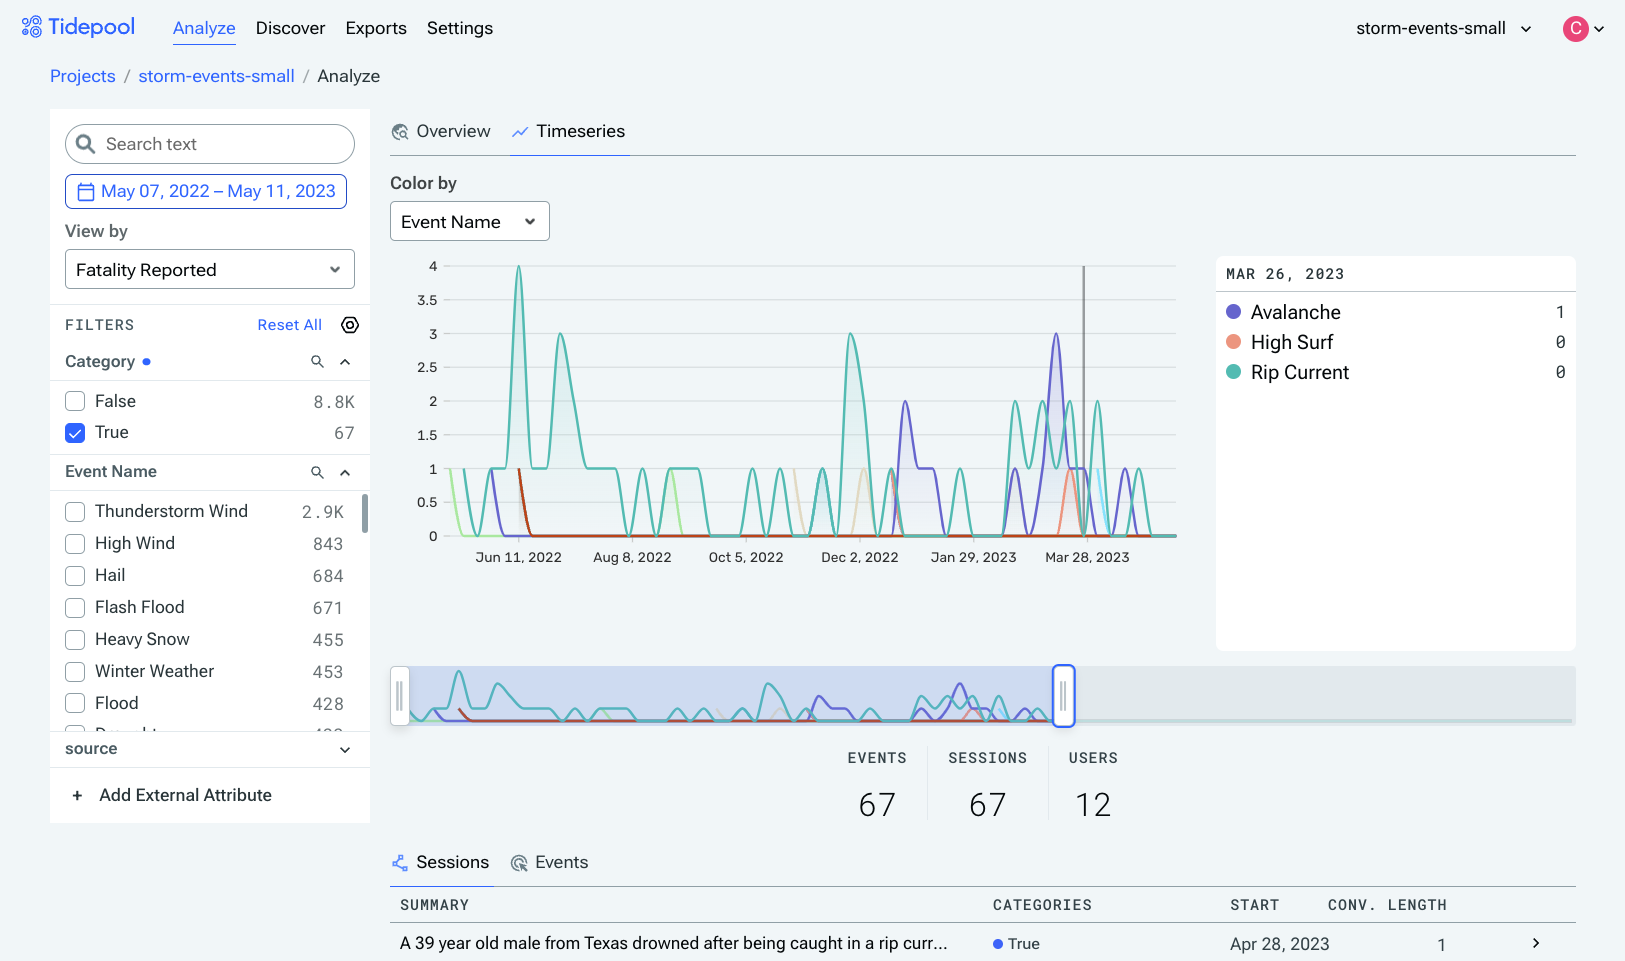
Timeseries View
Session Viewer
Clicking on any of the events in the table in Analyze view will open the session that event belongs to in the Session Viewer. Since a session may have multiple events, the event that was clicked will have a dark gray border around it.
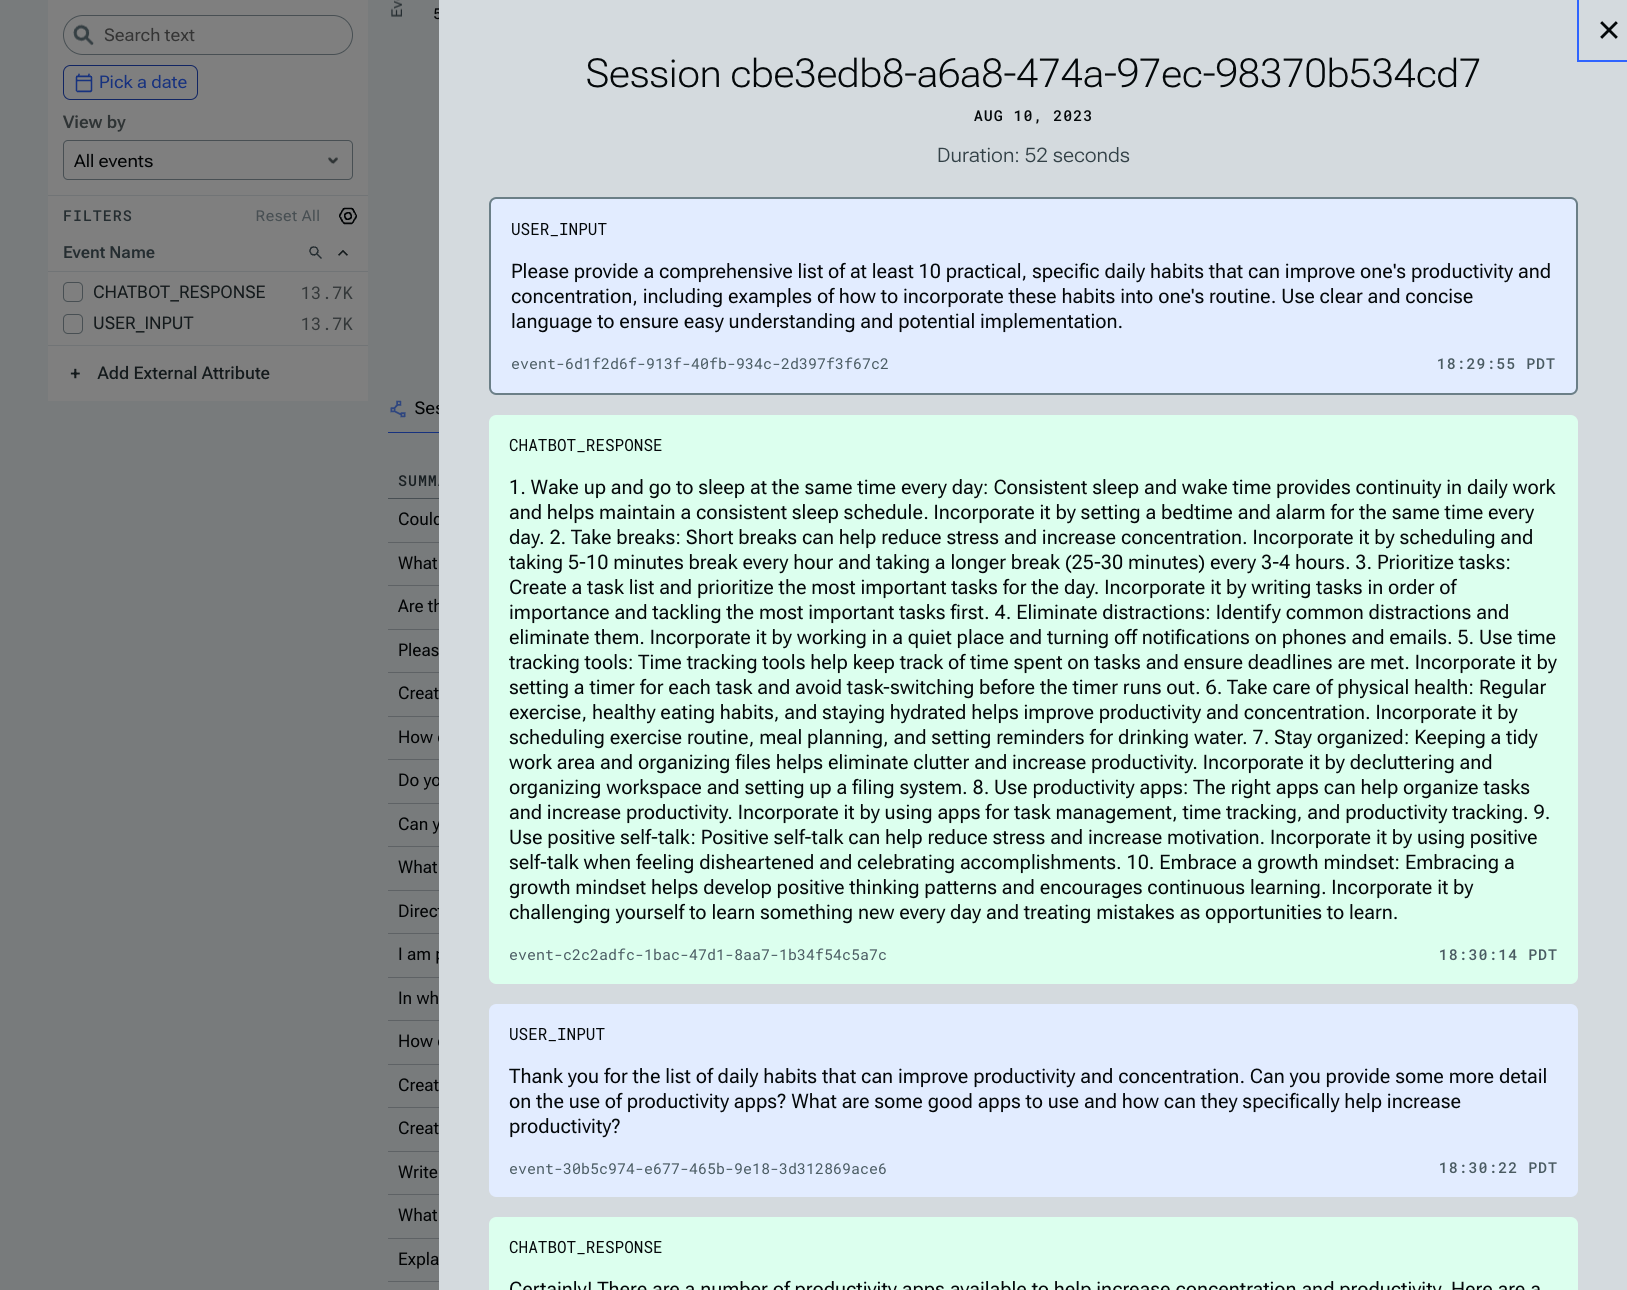
Tidepool provides a convenient way to view any session/event in context. Currently viewing a multi-part conversation between the user and a chat agent.
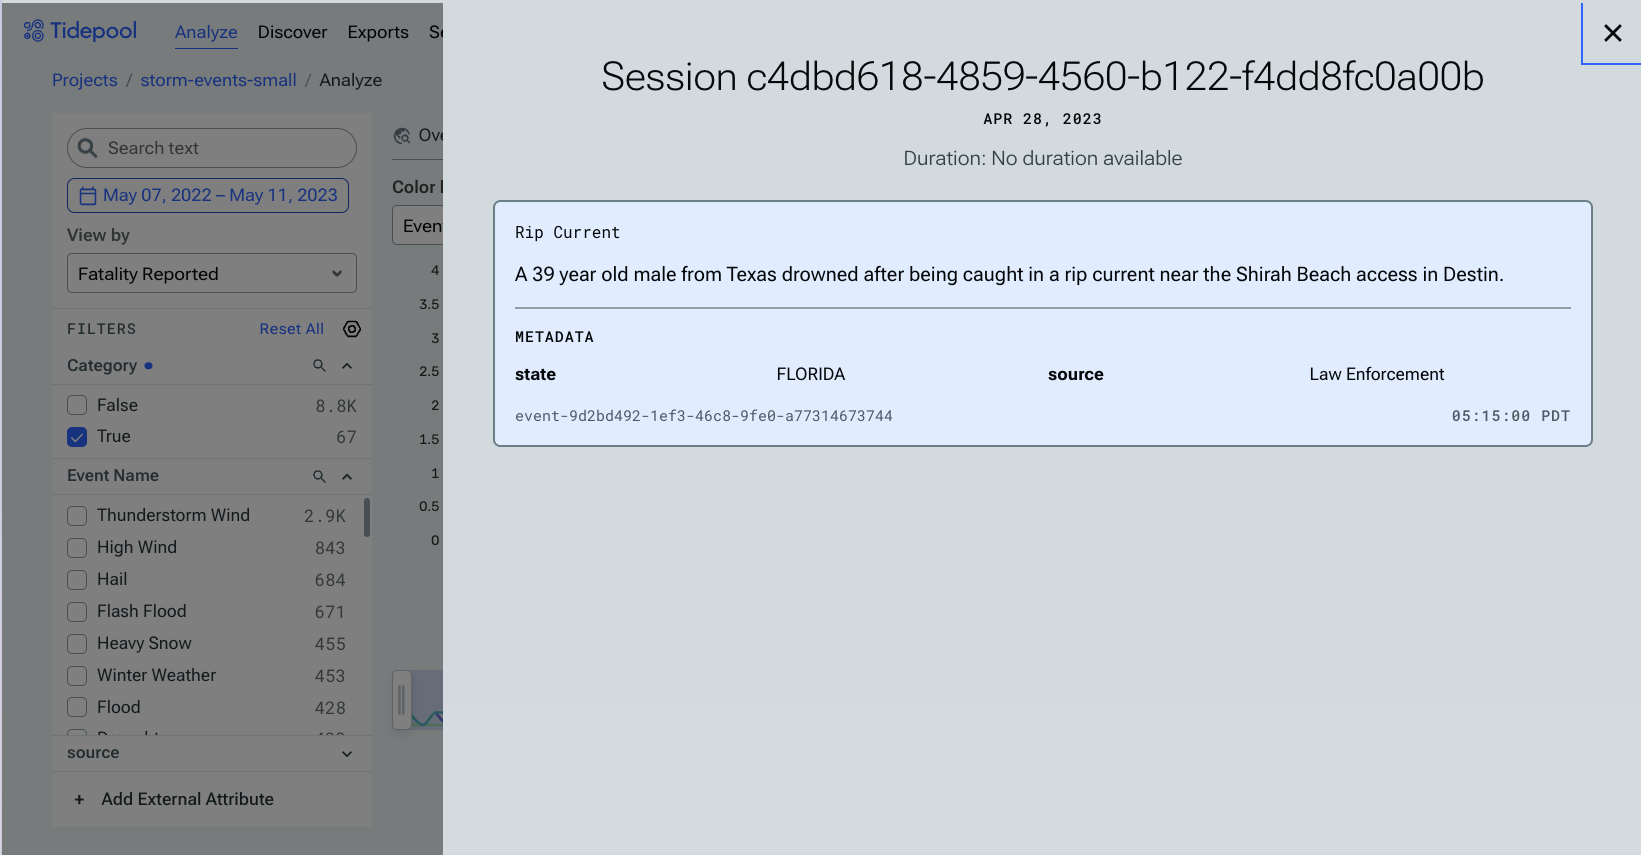
The Session Viewer also supports displaying any metadata attached to each session/event, if available. Metadata will be appended as a table to the end of each event.
Updated 6 months ago