Quickstart Guide
Sign up for a Tidepool account, import your data, and get started.
Set up Your Account and Organization
Sign up for An Account and Log In
Navigate to https://app.tidepool.so/login. Click Login and then sign up for a Tidepool account. You can use email and password, Google, or Github to sign up.
If someone at your organization has already signed up for Tidepool and you want to join their organization, skip this step and request that they invite you using the invite users to your organization guide.
Once you've signed up, finish setting up your account and log in to Tidepool.
Log in To Tidepool and Configure Your Settings
When you first log in to Tidepool, you'll be prompted to create your first project.
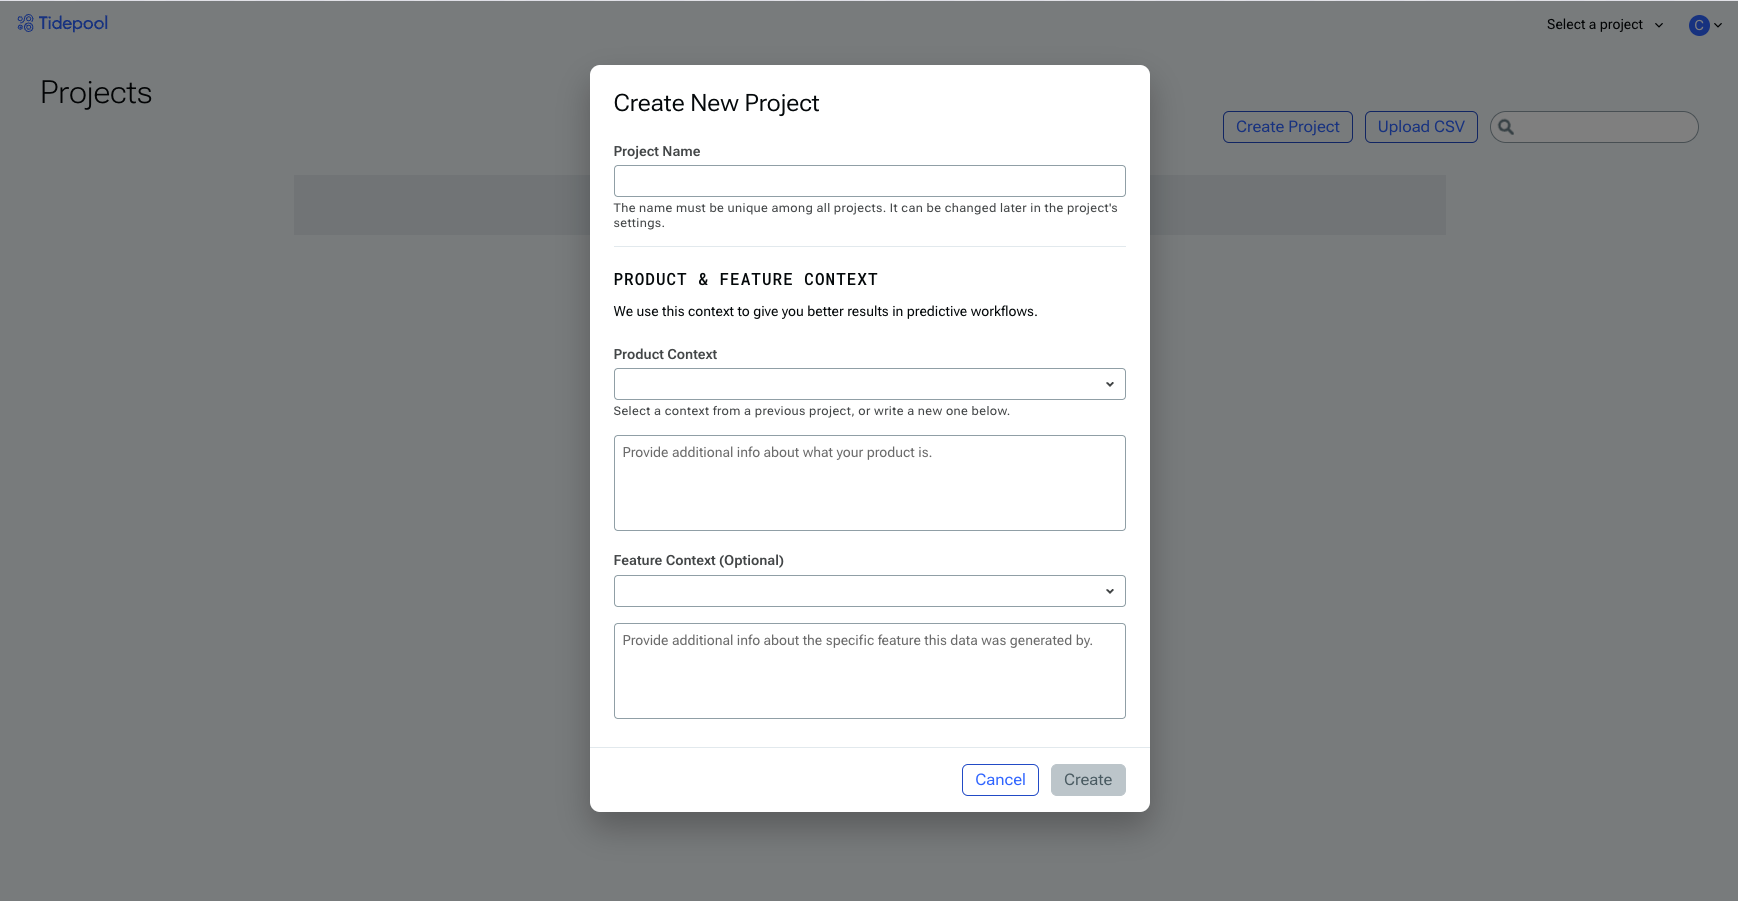
Logging into Tidepool for the first time.
At this point, you can access your organization settings from the letter/avatar in the upper right. Optionally configure things like
- Your account name
- Tidepool's appearance
- Your organization's name
- Your API keys
- Your Data Warehouse connections
- The other members of your team
- Your billing tier (by default you're on the free tier).
- Reference our pricing page for more information about upgraded plans.
eys section of the Settings page. Read our complete guide on managing API keys for more information.
Upload Data to Your Organization
The basic unit of data in Tidepool is an event. Events are user interactions with your product's text interface. Events are assigned to users (individual people performing actions in your app) and sessions (sets of events performed by a user that are linked by a Session ID, or because they occurred close in time).
There are a number of ways to get data into Tidepool. The two primary ways are to upload directly with CSVs, or to sync data from a data warehouse.
In this Quickstart, we'll assume you're uploading data from a CSV using the Tidepool API. Read our data upload guide for more details on setting up integrations.
Reach out to us via our Slack Community for help with data uploads or integration questions.
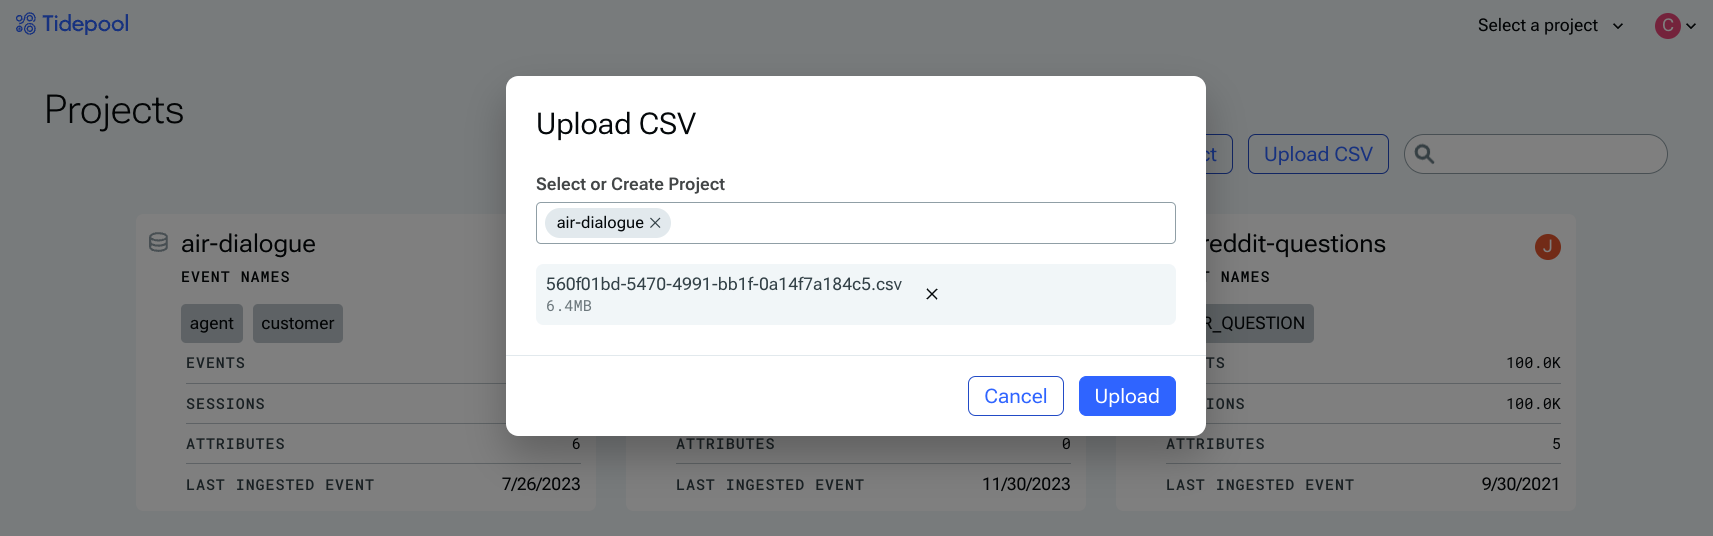
Upload Data Using the CSV Uploader
The easiest way to upload data is to use the in-app CSV uploader. Select an existing project (or type in a name for a new project), and then select a CSV smaller than 30 MB.
Note that the CSV must include columns titled event_name and text at a minimum. event_name is used to organize "types" of events; for example, whether the event is a user_message or a system_message.
See here for other recognized columns, which are used for things like linking events together via session IDs, assigning events to a user, and so on. Any extra columns not listed here will automatically be interpreted as metadata for that event, and can be used to analyze your events in Analyze view later.
Connect Your Data Warehouse
For production workloads and larger datasets, we recommend setting up a connection to your Data Warehouse.
When set up this way, Tidepool will read and write directly from your warehouse, never permanently storing your text data elsewhere. Loading new data into Tidepool is as simple as appending new rows to your configured data source table, and computed values from attributes you create will be written into new tables alongside all of your other warehoused data.
To get started, check out the guide here.
Upload Data Using the Tidepool Steaming Insert API (Deprecated)
The sample script below assumes:
- You have event data with, at a bare minimum, text. You can also include event IDs, user IDs, session IDs, event timestamps, event feedback, and arbitrary metadata (as a dictionary nested under the "properties" key for the event). Reference our API documentation for specifics about the expected schema and other details.
import requests # you might have to `pip install requests` if you don't have it installed
from requests.adapters import HTTPAdapter
from requests.packages.urllib3.util.retry import Retry
import csv
from time import sleep
from uuid import uuid4

#################################
# Set up URLs + request headers #
#################################

# Best practice for making a lot of requests: add automatic retries in case of network trouble
requests_with_retry = requests.Session()
requests_with_retry.mount("https://", HTTPAdapter(max_retries=Retry(total=3, backoff_factor=1, raise_on_status=False, status_forcelist=[500, 502, 503, 504])))

DATA_FILEPATH = 'PATH_TO_YOUR_DATA.csv'

# submission and validation endpoints - reference https://docs.tidepool.so/reference/
API_BASE = 'https://shoreline.tidepool.so/api/v1/events'

# API keys are project specific - reference https://docs.tidepool.so/docs/manage-api-keys
headers = {
    "X-Tidepool-Api-Key": "YOUR_API_KEY_HERE",
    "Content-Type": "application/json",
}

############################################
# Load in data, batch it up, and format it #
############################################

# A little utility to batch data, since the API takes up to 100 events per batch
def make_batches(all_entries, n=100):
    return [all_entries[i : i + n] for i in range(0, len(all_entries), n)]

# Function to populate + verify a formatted event for upload
def make_event_from_dict(entry):
    # Set all required fields from the entry
    event = {}
    event['text'] = entry['text']
    # An iso timestamp with timezone, such as '2023-08-10T21:26:27.302Z'
    event['timestamp'] = entry['timestamp']

    # These fields must be set, but here are sane defaults if you don't have them on hand
    event['id'] = entry.get('id') or str(uuid4())
    event['session_id'] = entry.get('session_id') or str(uuid4())
    event['user_id'] = entry.get('user_id') or str(uuid4())
    event['event_name'] = entry.get('event_name') or 'USER_MESSAGE'

    # Optional: any metadata you'd like to add to this event goes here
    event['properties'] = {}

    return event

# Note: your CSV must have a header row with column names for csv.DictReader to work
with open(DATA_FILEPATH, 'r') as f:
    formatted_events = [make_event_from_dict(d) for d in csv.DictReader(f)]
    batched_events = make_batches(formatted_events)

######################
# Make the requests! #
######################

# Validate a single batch of data before going through the rest.
validate_resp = requests.post(f'{API_BASE}/validate', json=batched_events[0], headers=headers)
validate_resp.raise_for_status()

# Submit all the batches!
for i, batch in enumerate(batched_events):
    track_response = requests_with_retry.post(f'{API_BASE}/track', json=batch, headers=headers)
    if not track_response.ok:
      print(track_response.text)
    track_response.raise_for_status()
    print(f"Submitted batch {i + 1} of {len(batched_events)}")
    sleep(0.5)
Analyze and Enrich Your Event Data
Once you've triggered the upload, you should see data start to appear in your organization within about 15 minutes.
Navigate to the Analyze page from the top menu bar, and you'll be able to see all of your events and sessions plotted by day. Click in to any row in the session table to see other events in that session.
At this stage, it's worth spending a few minutes scrolling through session and event data to get a feel for what the overall dataset looks like. This can help you pick up on potentially useful attributes to create in the next step.
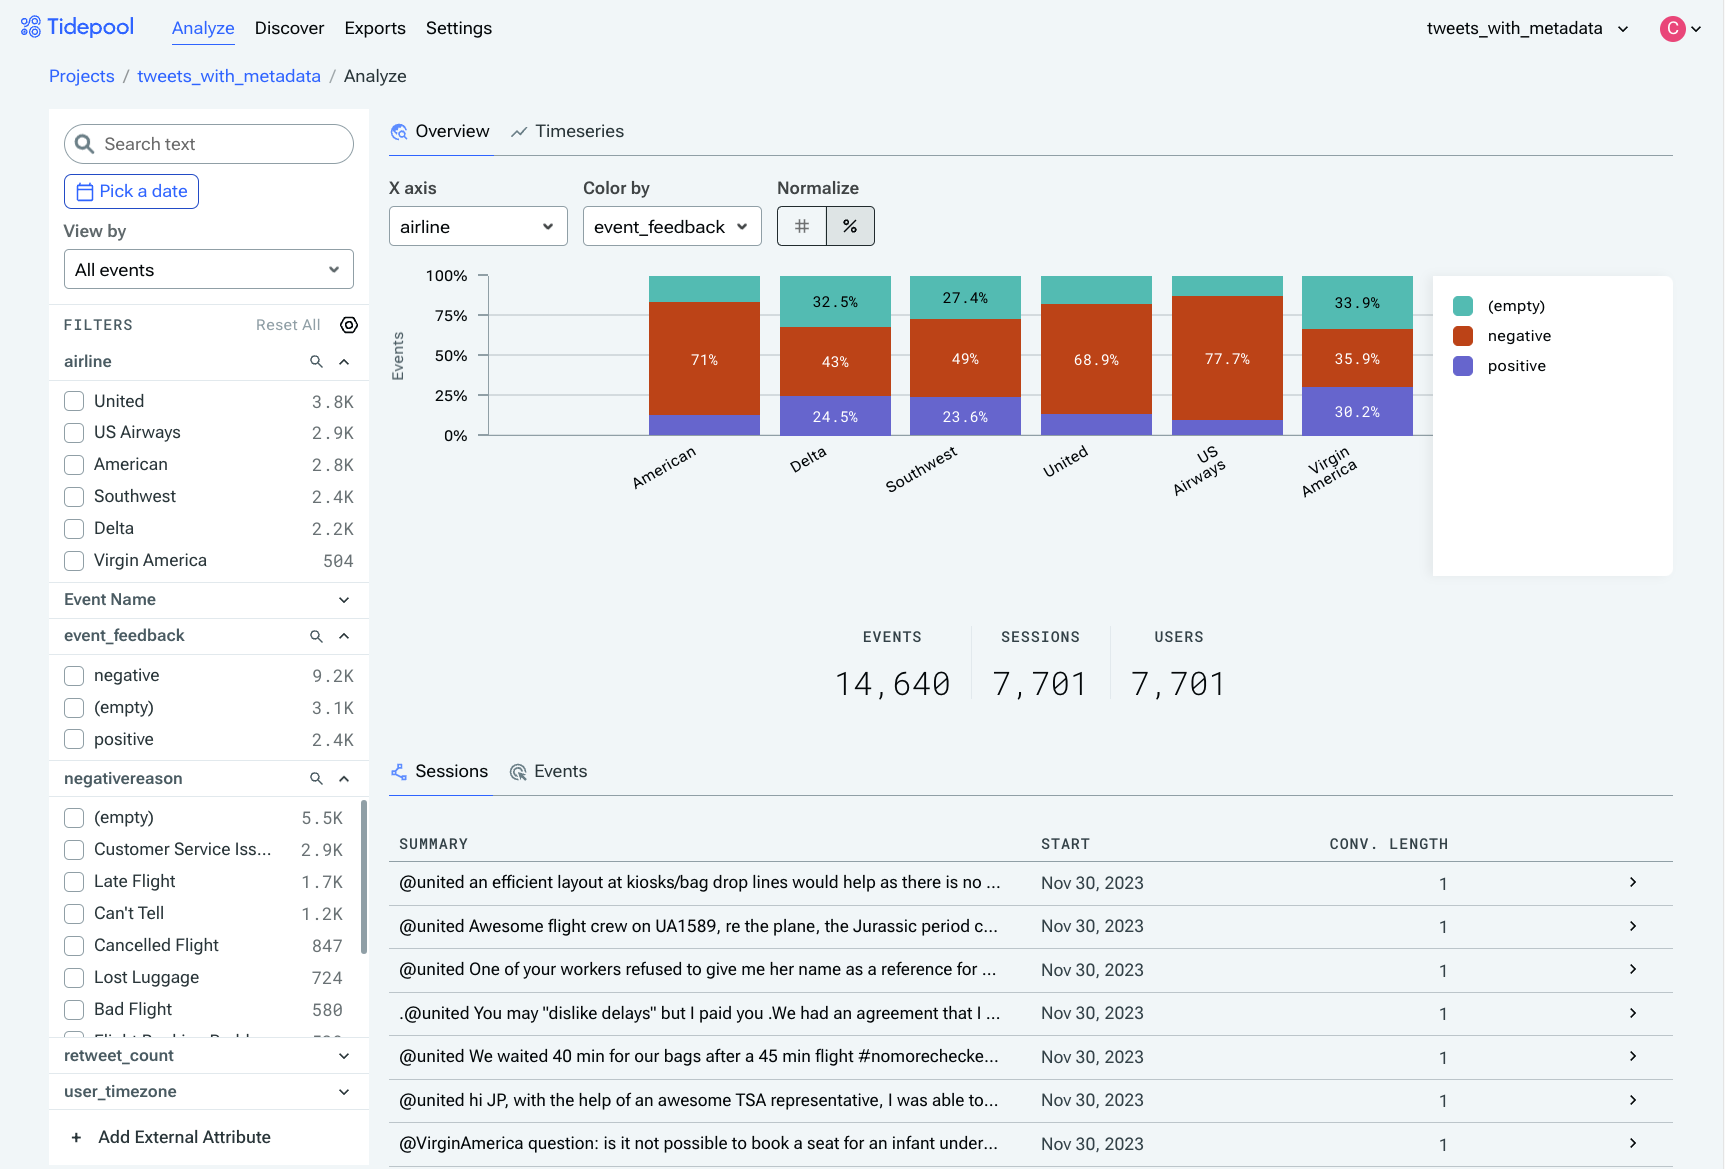
Viewing tweet events at a high level, organized on the X axis by the airline that was tweeted at, grouped by whether the interaction was negative or positive (both user-provided metadata fields).
Clicking any event in the table will open the Session Viewer, allowing you to view the entirety of that session, and/or any additional metadata associated with that event.
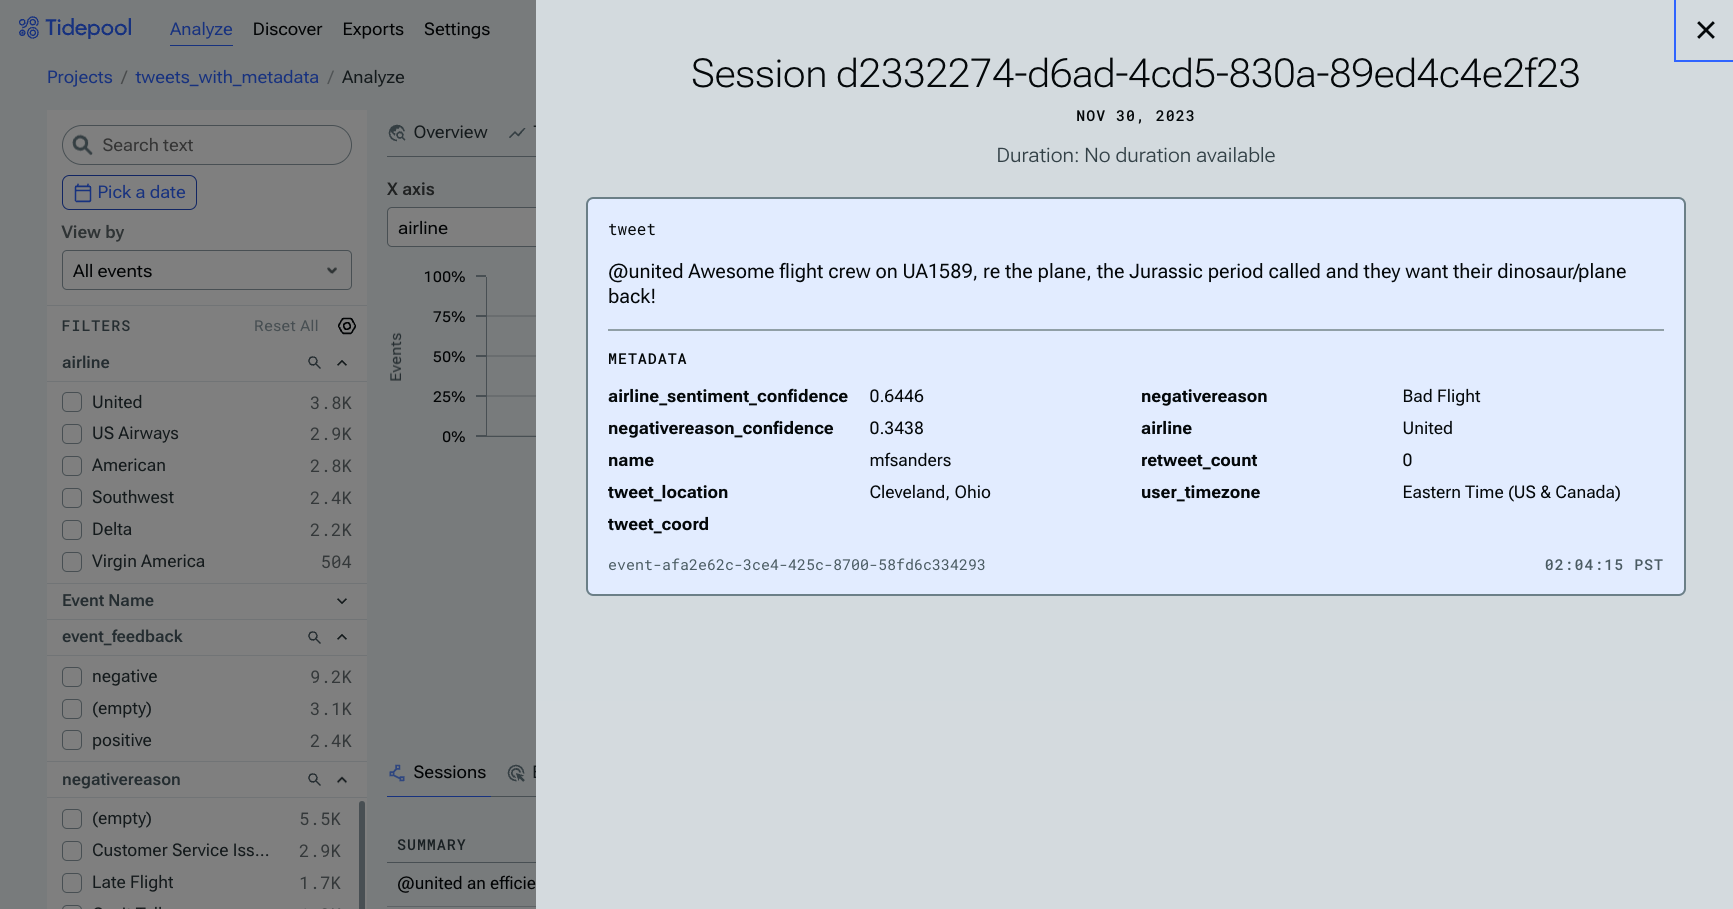
Viewing an individual event's details in the Session Viewer. This user isn't particularly pleased about United's plane.
Create An Attribute
Once you've gotten a feel for your dataset, you can start creating attributes to automatically group and categorize the unstructured text.
Navigate to the Discover page from the top menu bar and click the New Attribute button.
When creating a new attribute, you can either define your own attribute and categories or you can let Tidepool suggest potentially useful attributes and categories for you. Tidepool has the ability to predict attributes based on correlations with a given metadata field, although metadata isn't required to generate predictions.
If you don't already have an attribute in mind, try using Suggested Attributes. You'll be prompted to provide some context about your product (which you've likely filled in already while creating a project). For predictions, it's required to also explain a little bit about the feature or interface the events are sourced from. Detailed context greatly increases the quality and specificity of recommendations.
After clicking Generate, it will take around three minutes to crunch your data and come back with predictions, so feel free to stretch or grab some tea in the meantime.
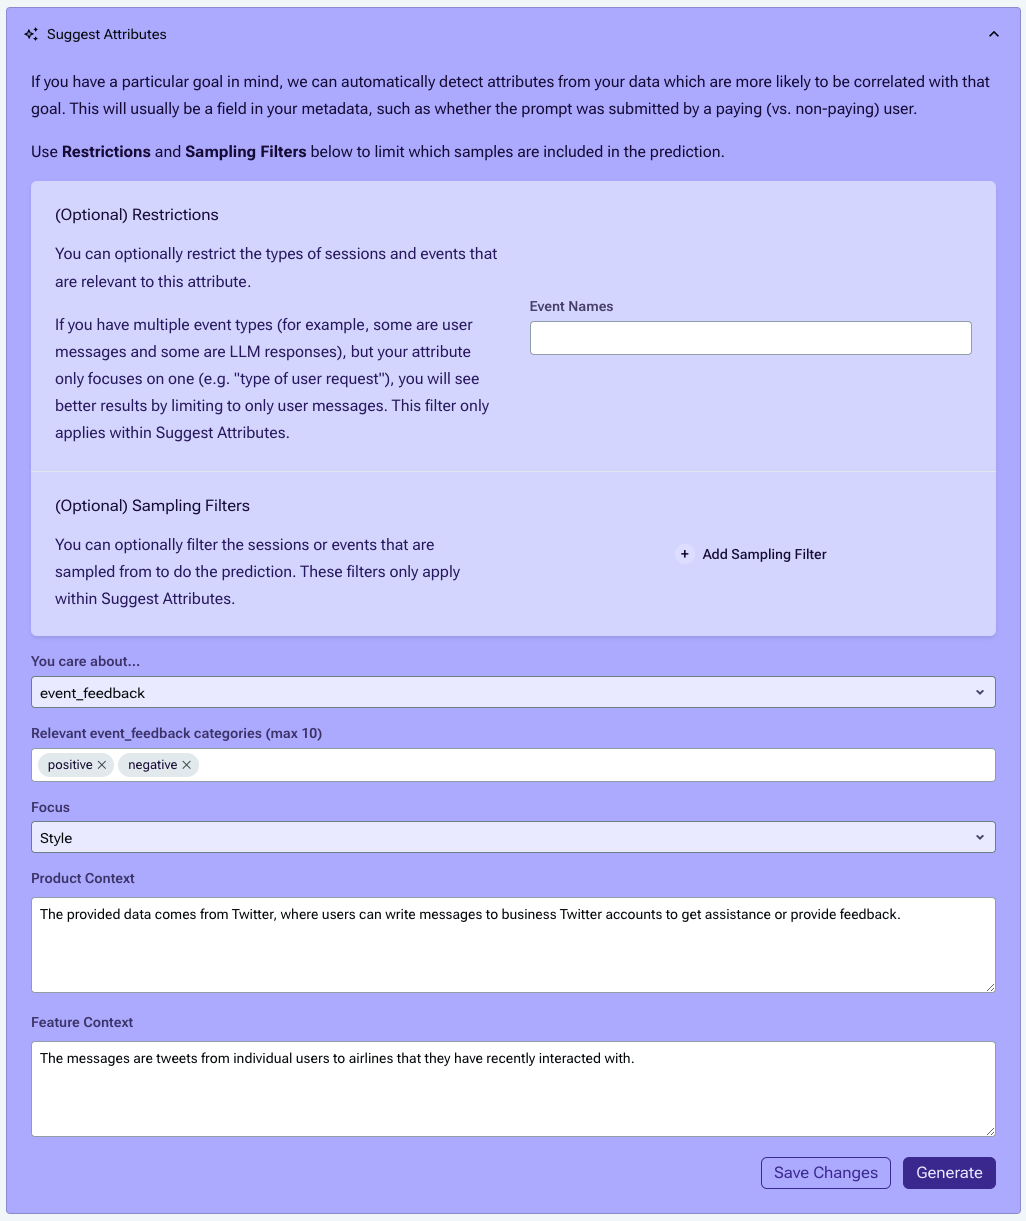
When predictions are done, they'll be populated below, and you can choose whether to keep one or try again.

For this guide, we'll keep "mention of specific entities" and click Keep to auto-populate the rest of the form (including any filters you used in the Suggest Attributes form), then proceed to refinement.
Reference the detailed attribute creation guide for more information about creating attributes.
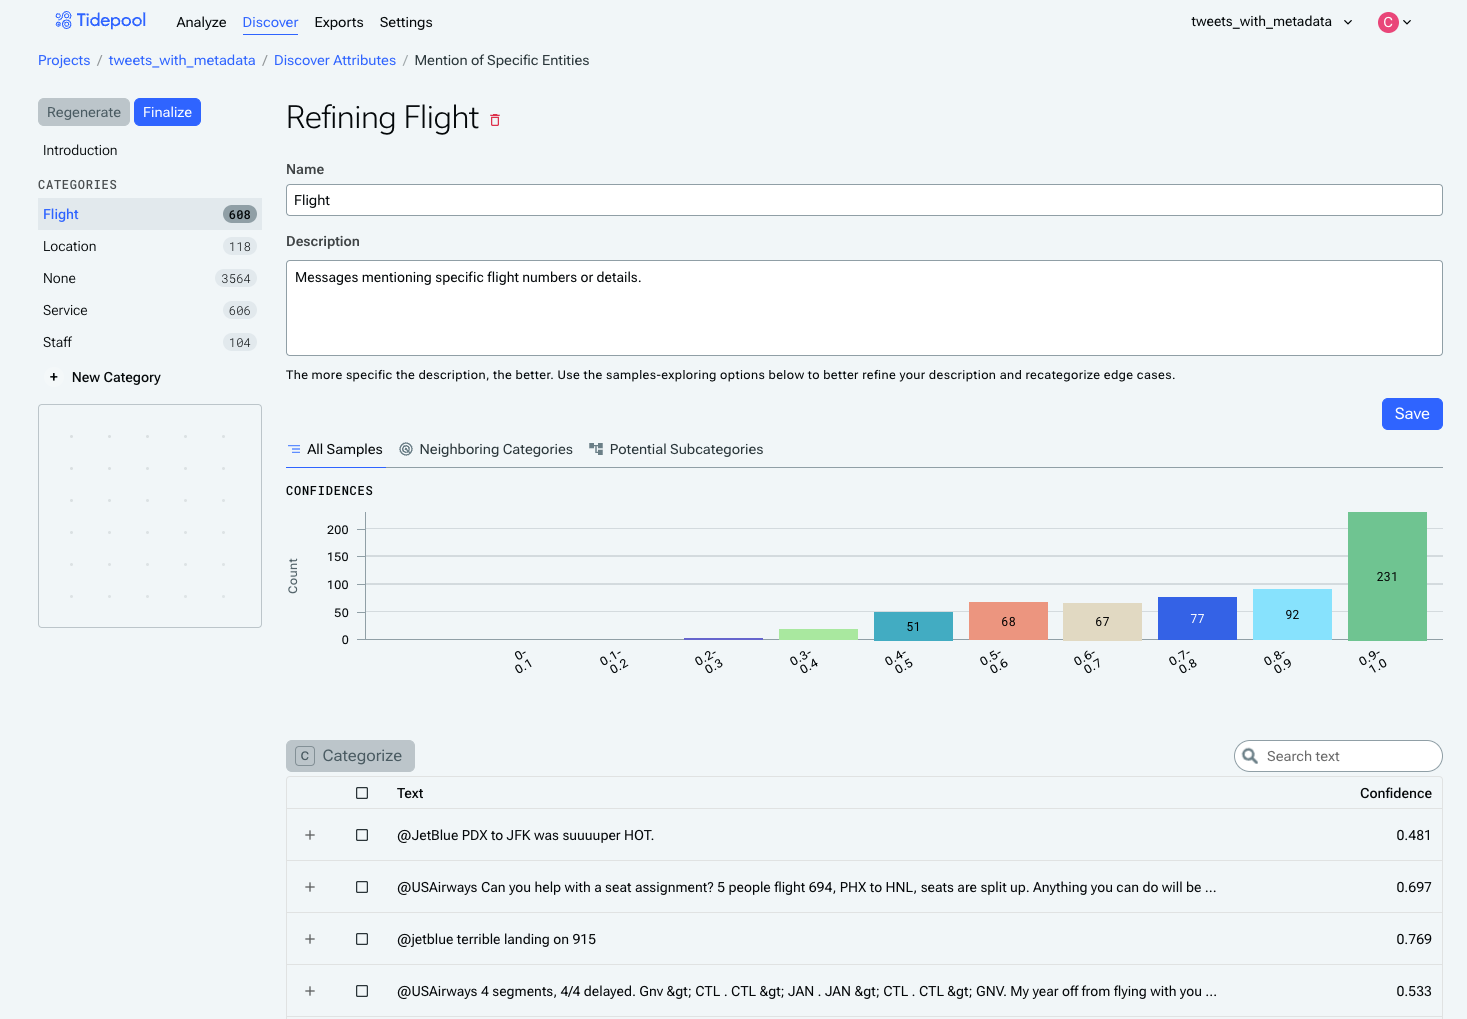
Refine the Categories
Once you've created an attribute, you'll enter the Refinement step. Refinement uses a set of 5,000 examples from your data to ensure proper representation of the data's diversity.
In this step, you'll have a chance to refine the definition of each category, and how you want examples to be allocated amongst categories. Categories generated by Suggest Attributes will come with descriptions attached, but can be edited as-needed to include or exclude particular types of examples.
Category refinement gives you an opportunity to see how events are mapped to categories within the attribute and either:
- confirm the category is working as expected
- update the category description
- break a subset of events from the category out into one or more new categories using the cluster view.
Review each category for the attribute and update the description or create a new category from the cluster view. You can also delete categories using the red trash can next to their name.
Iterating on Categories
Each category shows the confidence distribution for the examples assigned to it - a category with more examples towards the right side of the distribution is a straightforward and well-understood category, while a category with more examples in the middle areas of the distribution is likely harder to learn and/or is receiving mixed information about which examples should be assigned to it.
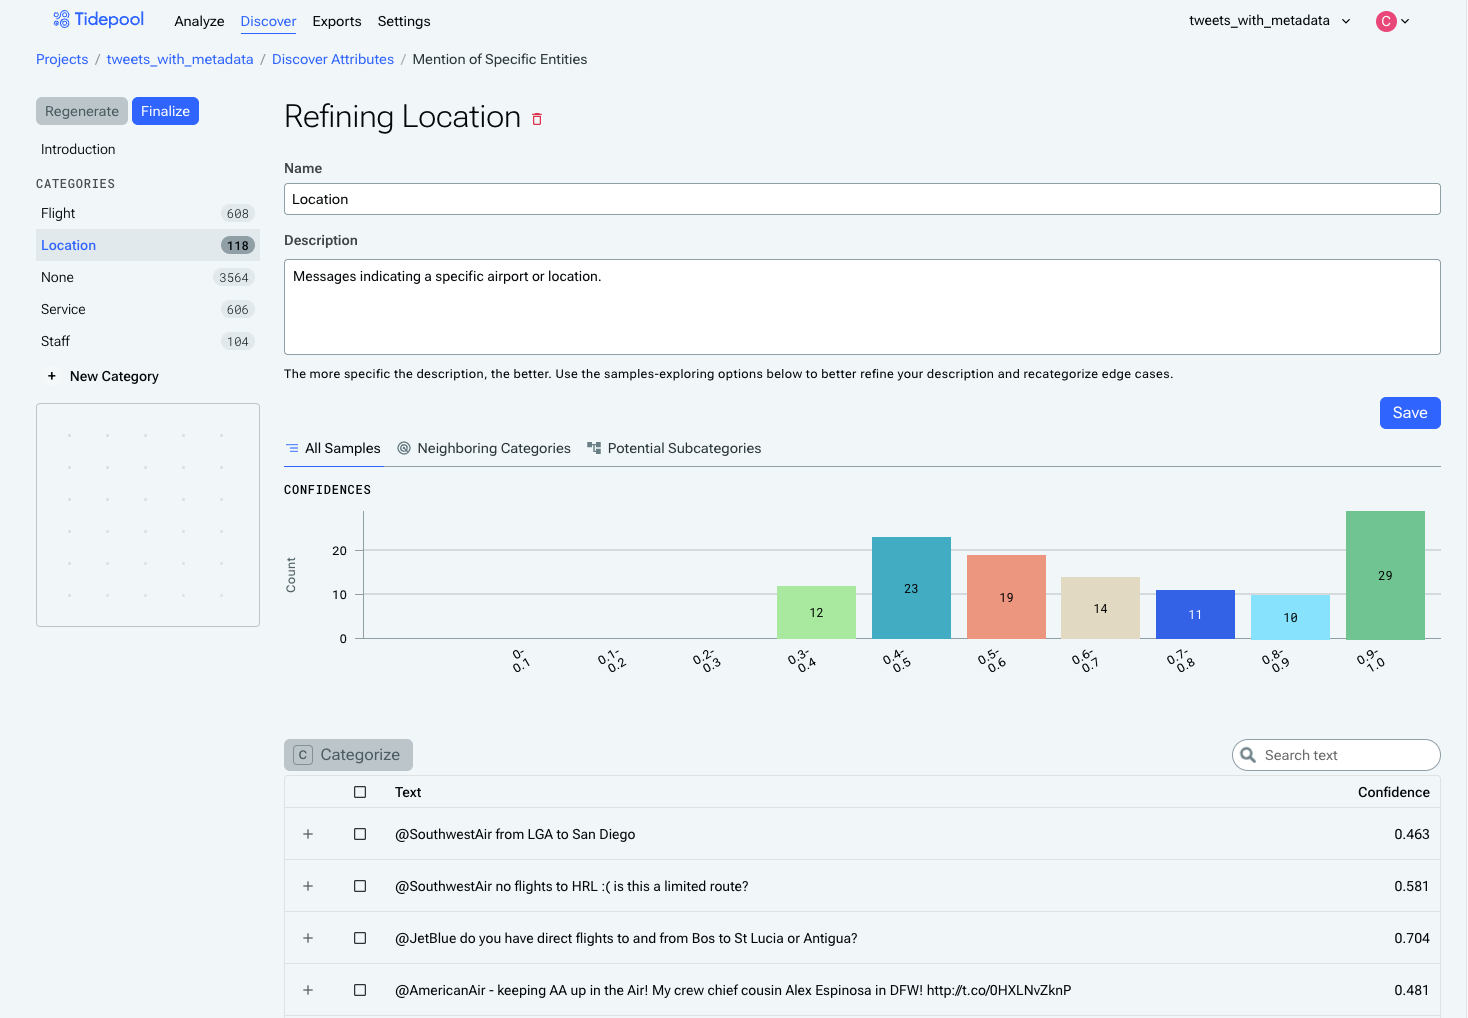
Importantly, categories are mutually exclusive, so if an event could plausibly belong to more than one category, the definitions are not sufficiently fleshed-out. For example, we can see here that there is overlap between the "Flights" category and the "Location" category, in that Flight examples often use two airports to describe which flight they were on, while the Location examples will also include an airport.
You can reassign examples from one category to another category using the checkboxes and the Categorize button, although this should be used sparingly. It will generally provide better results if you can describe in words (using the category description) why examples should belong in that category and not another.
Under the Potential Subcategories tab, Tidepool will suggest subtopics within that category, providing the opportunity to elevate a subtopic to a proper category if it's relevant to your analysis. Click on the bar for that subcategory to filter down to just those examples, then click the checkbox at the top of the table to select all of those examples, then click Create New Category with Selected Samples.

Remember that if you elevate a subcategory to a category, you should ensure that you update its description or the original parent category's description to ensure the two are still mutually exclusive.
After making changes to categories, click Regenerate to refresh how the categories are applied to the examples, using your new instructions. If a category was deleted since the last generation, this will reassign examples that were previously assigned to the deleted category to their new likeliest category.
Finalizing the Attribute
Once you've reviewed all of the categories and are happy with the results, click the Finalize Attribute button in the top left of the screen.
Finalizing the attribute will lock the attribute's categories and being the process of calculating which category each event should be assigned to for the full dataset.
Any new event data submitted to the project will automatically be categorized for all finalized events.
Reference the expanded category refinement guide for more information about refining categories and finalizing attributes.
Analyzing the Categorized Events
Once the attribute is finalized, we'll assign each element in the full dataset to a category for the attribute. This process can take up to an hour, depending on how much data you have, so after finalizing an attribute, you might want to take a little break and then check back later.
Navigate to the Analyze page from the top menu bar. To begin analyzing using your finalized attribute, click the "View By" dropdown on the left-hand side, and use the controls above the chart to either place Category on the x-axis, or use it to Color By.
The left-hand side also provides the ability to filter by any arbitrary metadata, including category. By default, everything is included, so having all categories selected will produce the same chart as not having any category selected.
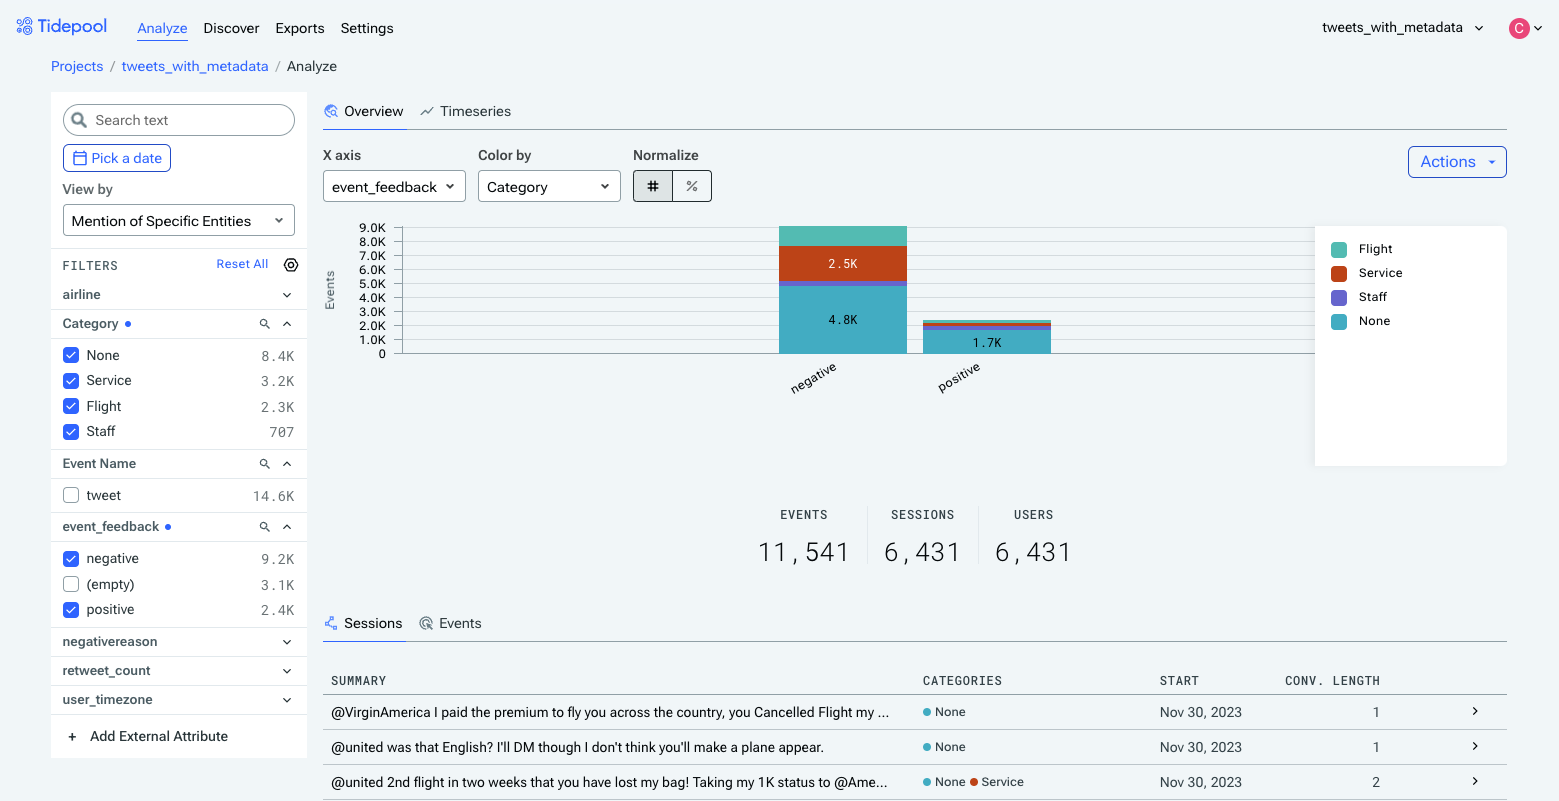
Viewing the event_feedback metadata field by whether specific entities are mentioned.
To see the percentage that a section of a bar accounts for, just hover over it, or switch to a normalized-to-100% view using the Normalize toggle.
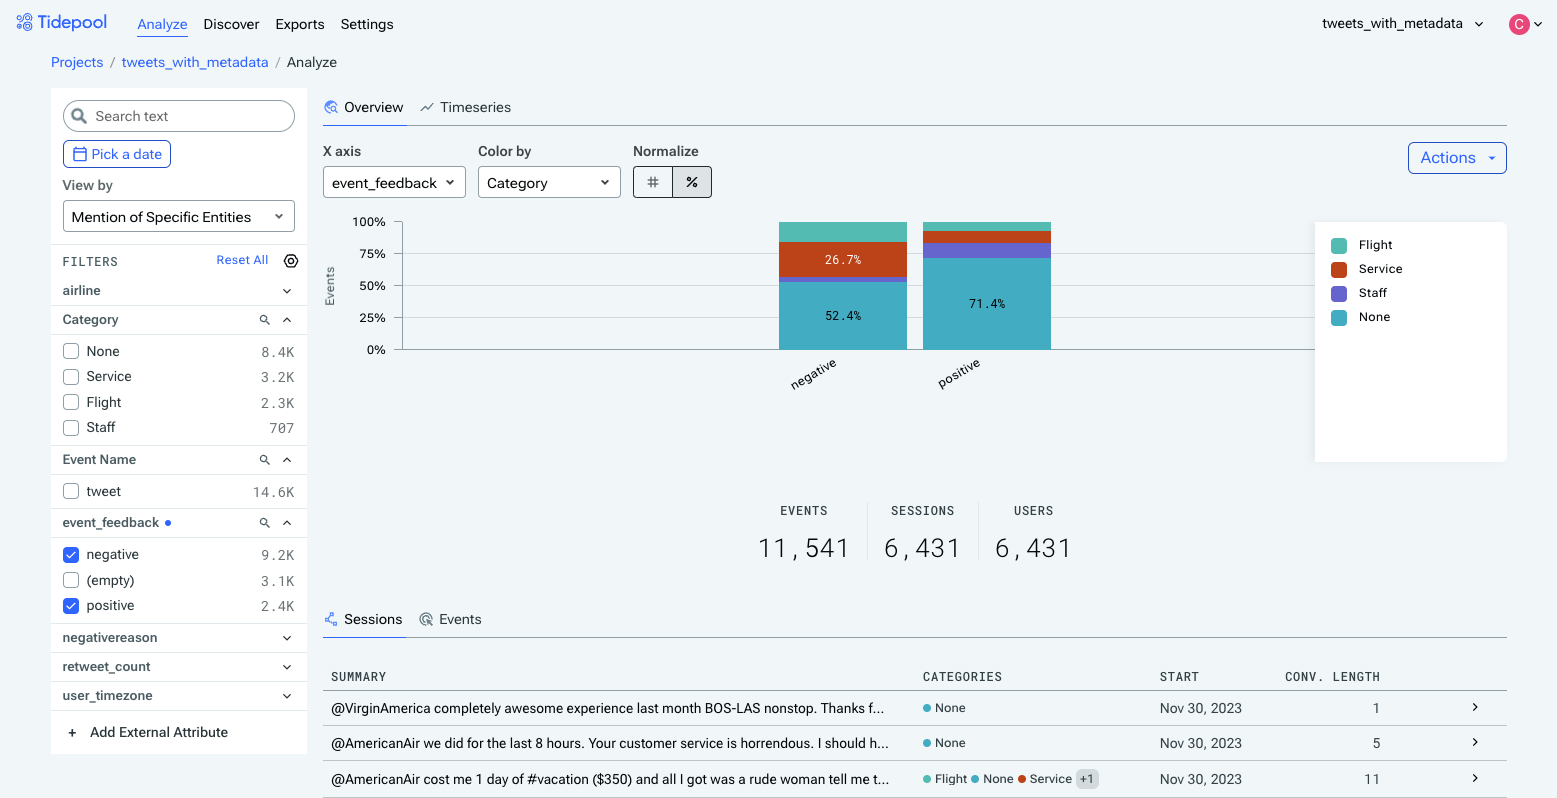
The same chart, normalized.
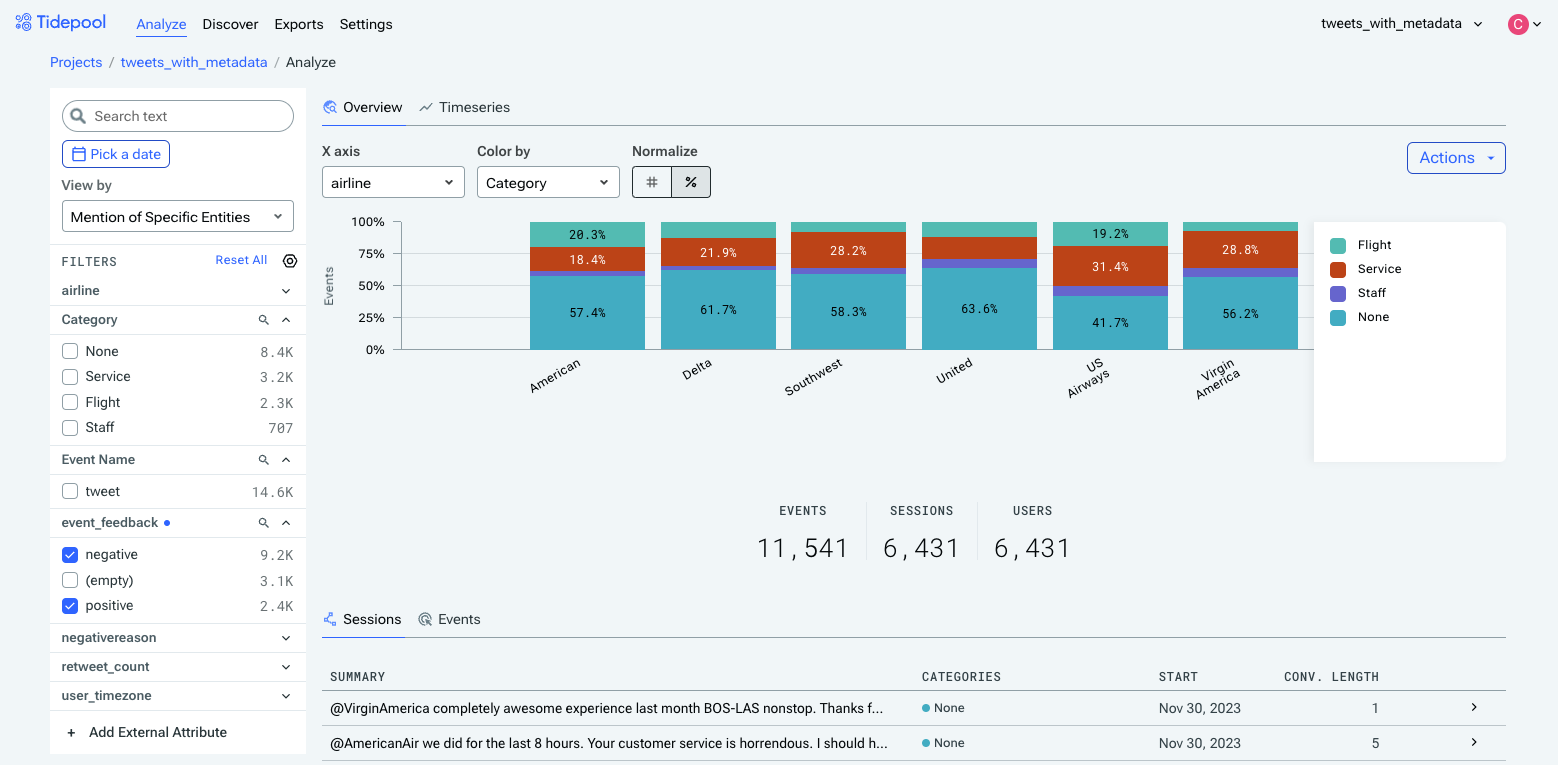
As might be clear by now, attributes are even more useful when you provide more metadata to analyze them against. For example, here's the data with airline (provided metadata) on the x-axis and colored by category. We can see that, for example, American has the lowest proportion of staff-related feedback, and US Airways has the highest proportion of service-related feedback.
Clicking into one section of the bar will filter the displayed Sessions/Events down to those belonging to that group. We can see in the table that most of American's staff-related feedback is users giving praise to specific people.
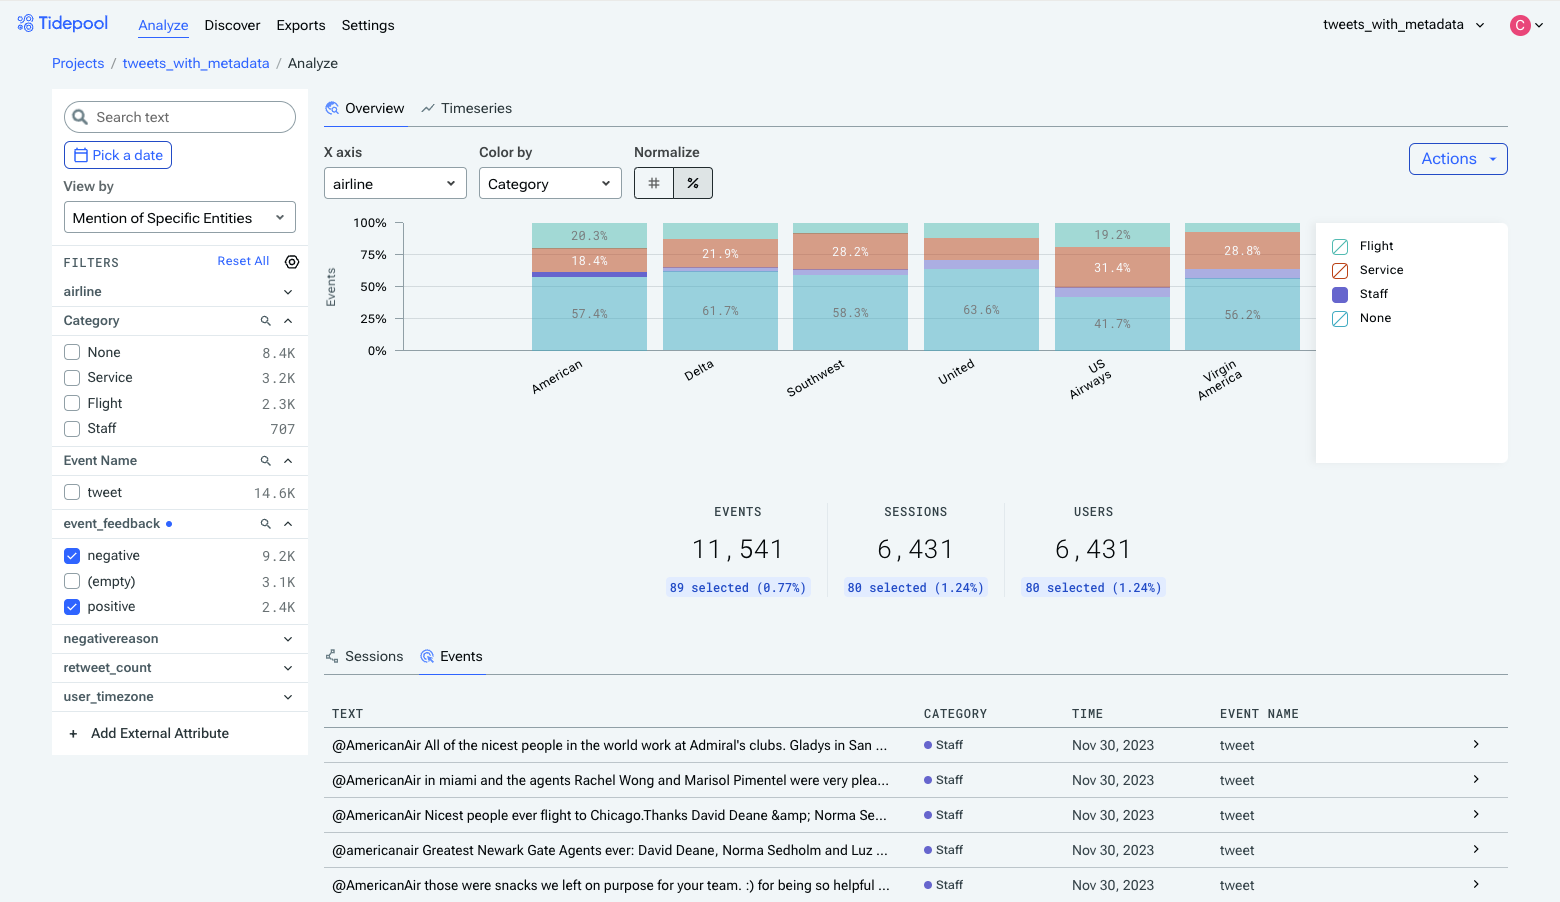
Filtering down to staff-related feedback for American Airlines.
Check out Analyze Text Events for more info on all the available functionality in the Analyze view.
Exporting Data from Tidepool
Exporting data from Tidepool is simple. From the Analysis view, click the Actions button in the upper right, then select any subset of the available columns to include in the export.
Note that any currently-applied filters will apply to the export. If you want to export the entire dataset tagged with the new attribute, make sure to click Reset All under Filters so that all the filters are removed.
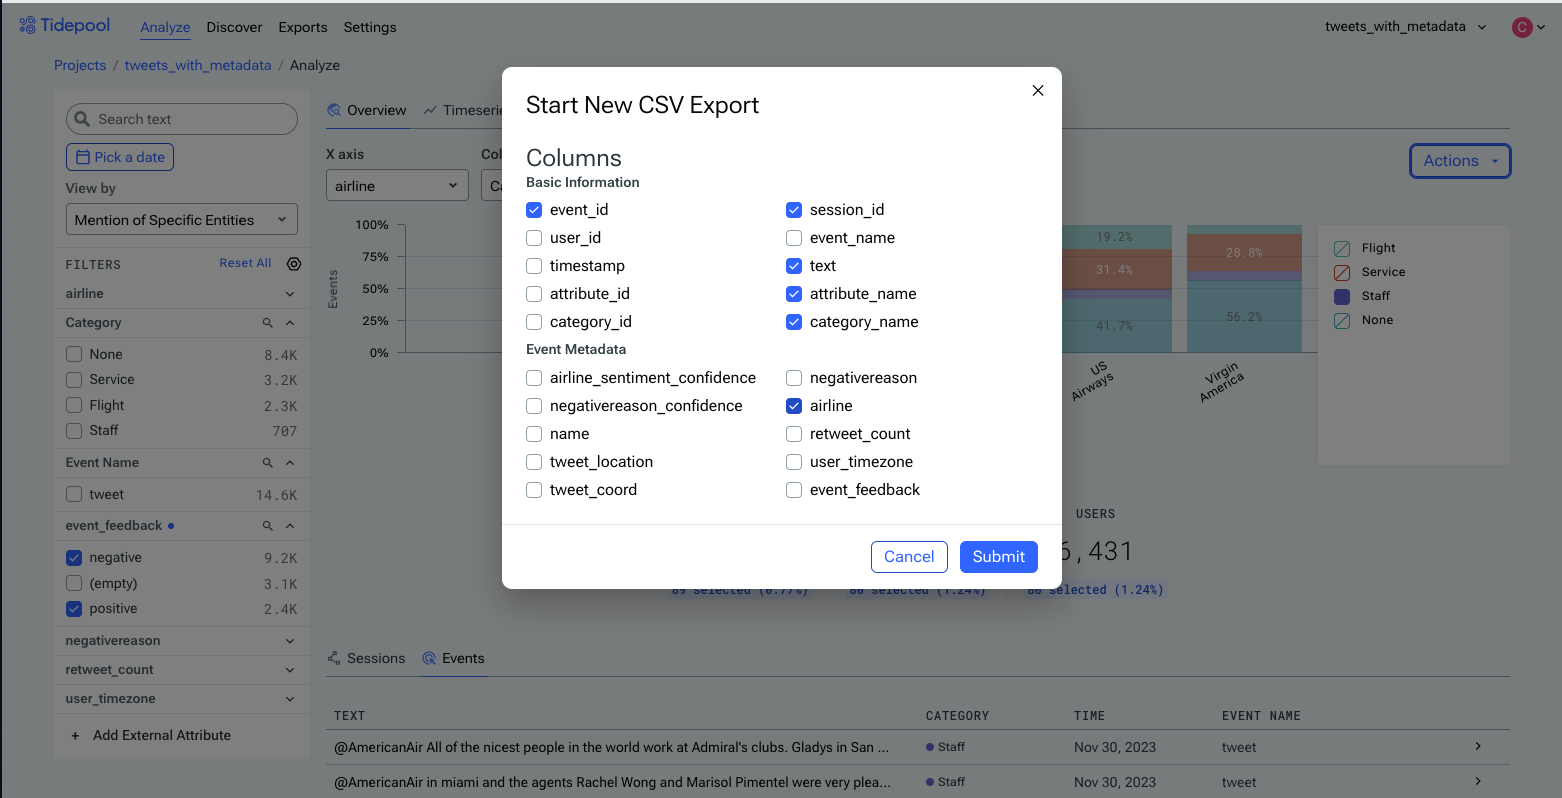
The CSV Export dialog. Select any subset of the available columns and click Submit to queue the export.
CSV export is asynchronous, so you can initiate any number of exports and download them later in Exports (found in the top navigation bar).
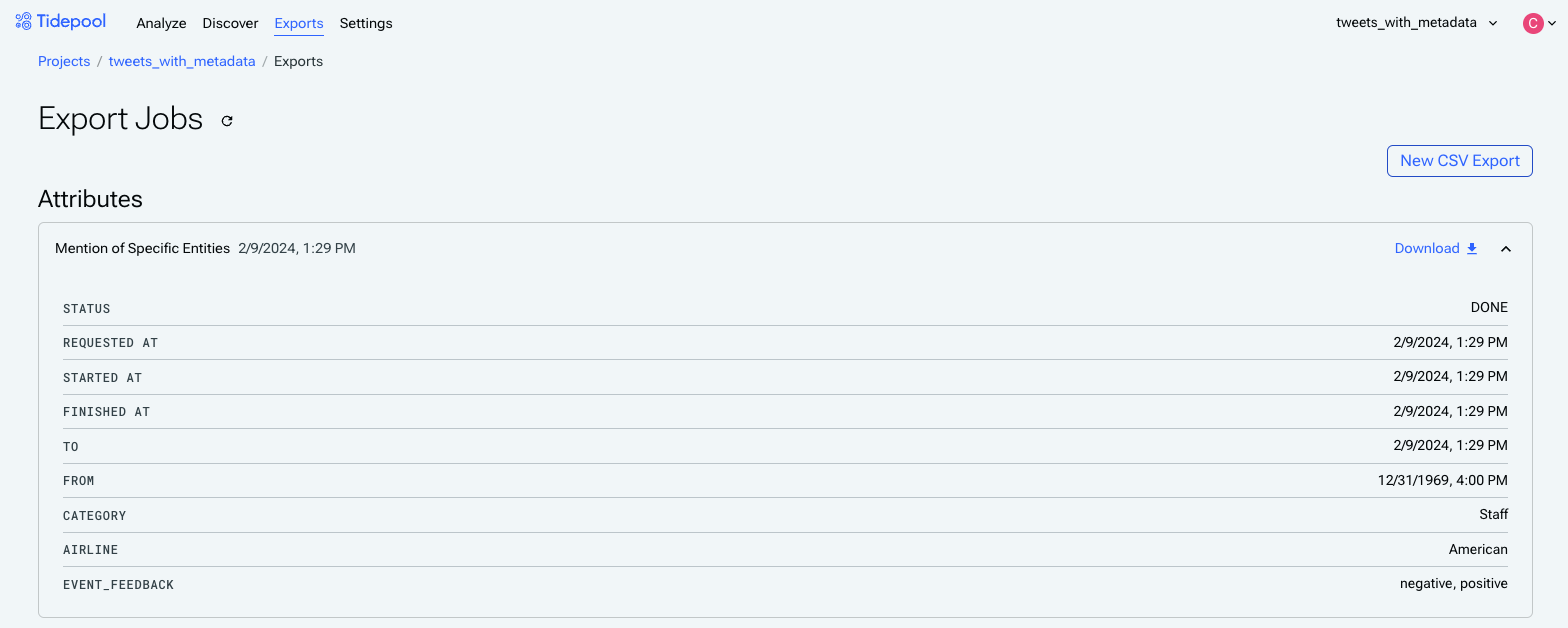
All past and current export jobs will be listed here, and they'll include info about their status as well as any applied filters for that subset. Exports of only a few thousand rows will typically be instantaneous, but larger datasets will take longer.
What's Next?
Now that you've completed the Tidepool quickstart, you should understand the basics of getting started uploading data to Tidepool, creating and refining attributes, charting categorized event data for analysis, and exporting data for use in other tools.
Automated nightly exports, such as to a data warehouse or analysis tool, are on our roadmap. If you'd like to use this, let us know!
Lastly:
- Join the Community to connect with the Aquarium team, give us feedback, stay up to date on the latest Tidepool news.
- Invite your team to collaborate on your enriched data in Tidepool.
- Continue adding new event data and creating new attributes to understand how your users are interacting with your app.
Updated 3 months ago